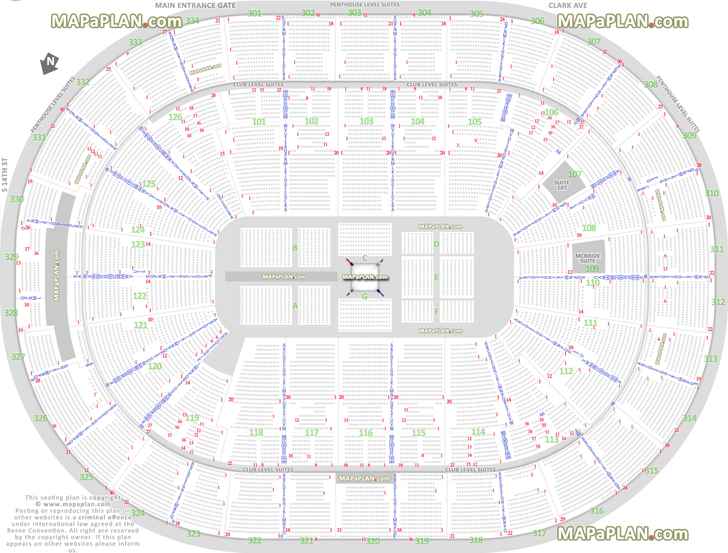
Enterprise Center arena seat & row numbers detailed seating chart (formerly Scottrade Center)
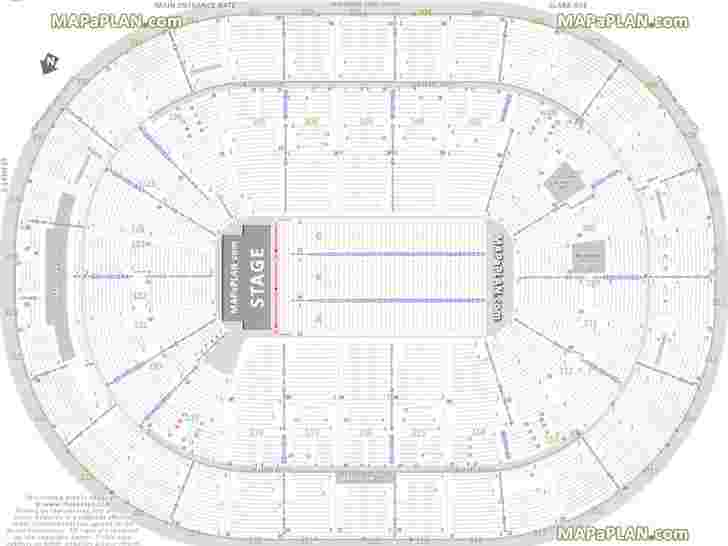
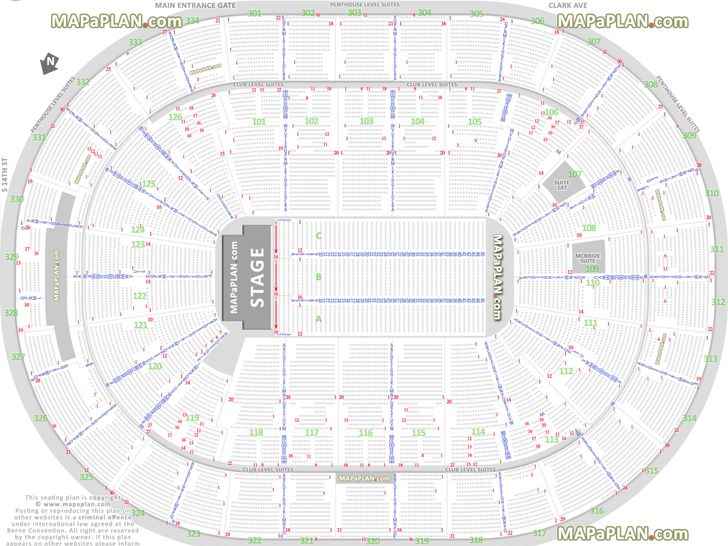
Detailed seat & row numbers end stage concert sections floor plan map with arena Plaza, Club & Mezzanine level layout - St. Louis Enterprise Center seating chart
How to find best seats using St. Louis Enterprise Center seating chart with seat and row numbers, MO? (formerly Scottrade Center)
In the end-stage fully seated concert configuration the best seats in the Enterprise Center are the first 1-15 rows in floor sections A, B, C. The floor rows further back are OK however all floor seating is set on a flat floor so if a tall person is sitting (or standing) in front of you the view may be slightly obstructed/ restricted. The rows in the floor sections are typically numbered from 1 up to 45, whereas the seats are numbered from 1 up to 12 or 16 ascending right to left when looking at the stage. When buying your tickets you can use the venue seating charts on this page to find the individual seat numbers offering optimum central view of the stage. Please note that for some events the floor seats are rearranged and the floor forms a general admission standing section or sports area (Blues hockey, NCAA basketball). Surrounding the floor are Plaza & Club level 100 and Mezzanine 300 bowl sections numbered 101-126 & 301-334. These are set on inclined risers so even the back rows can enjoy an unrestricted view of the stage. The top seats in the lower tier are close to the stage in sections 101, 118, 102, 117 and then, 103, 116, 104, 115. In fact, these locations should offer much better experience than the back floor sections. Sections 105-114 offer a good, full view of the entire stage, however at a considerable distance so you will probably not be able to see the facial expressions of the performer. Row numbers are A-W followed by AA up to KK in 100s, and A up to R in 300s. Seat #1 in the bowl sections is closest to the section with a lower number and the seats numbering is from 1 up to 30 in some sections. The exact seat numbers are shown on our seating charts.
View from Section 112 - Row P - Seat 8 - Virtual venue 3d interactive interior tour & inside concert stage picture showing 100 Plaza & 300 Mezzanine levels, suites without general admission (GA) - St. Louis Enterprise Center seating chart
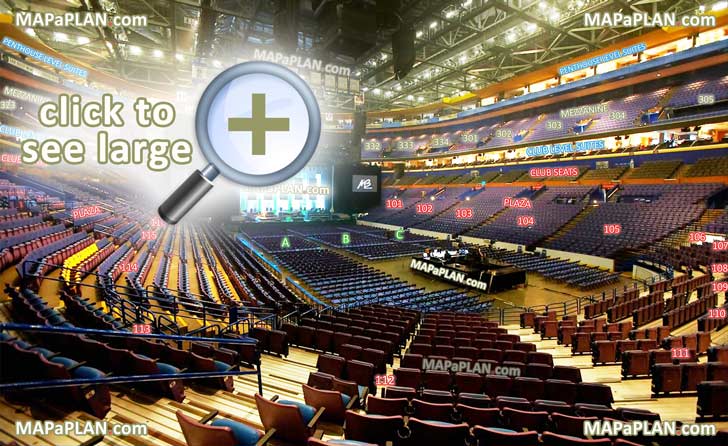
You can view, download or print a full, high resolution (detailed, large) version of this image by clicking on the plan itself
St. Louis Blues NHL hockey game arena stadium - Individual 'find my seat' locator showing how are seats & rows numbered in VIP Glass rinkside, Double Attack shoot twice & corner sections - St. Louis Enterprise Center seating chart
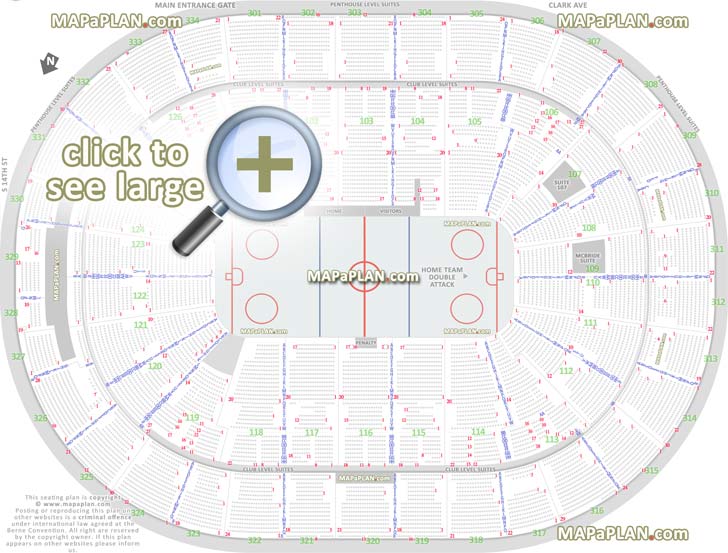
You can view, download or print a full, high resolution (detailed, large) version of this image by clicking on the plan itself
View from Section 308 - Row N - Seat 12 - Ice hockey rink showing Blues home bench, Visitors, Penalty, Club & Penthouse level suites, Bud Light Zone Loge Boxes - St. Louis Enterprise Center seating plan
You can view, download or print a full, high resolution (detailed, large) version of this image by clicking on the plan itself
NCAA Missouri Valley Conference College Basketball Tournament - Best, partial, obstructed view seat finder tool with precise detailed aisle, courtside, sideline & court baseline seat numbering location data - St. Louis Enterprise Center seating map
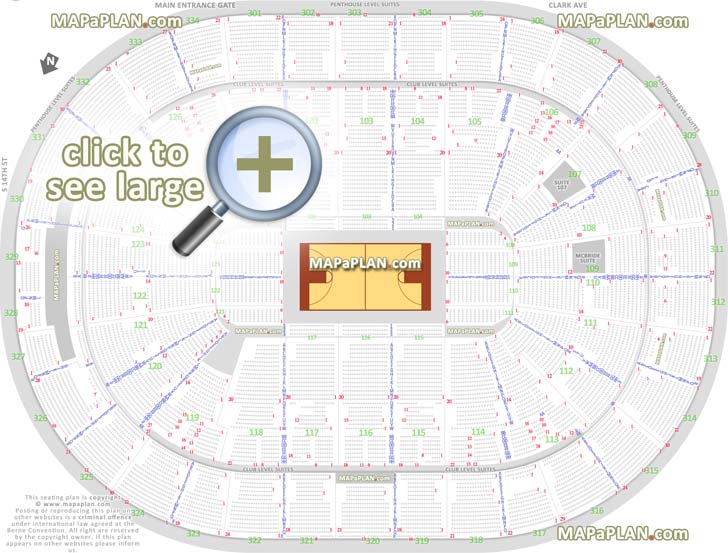
You can view, download or print a full, high resolution (detailed, large) version of this image by clicking on the plan itself
View from Section 328 - Row M - Seat 2 - Panorama showing Plaza (lower) & Mezzanine (upper) levels, luxury premium VIP all-inclusive seating & private party deck rooms - St. Louis Enterprise Center seating layout
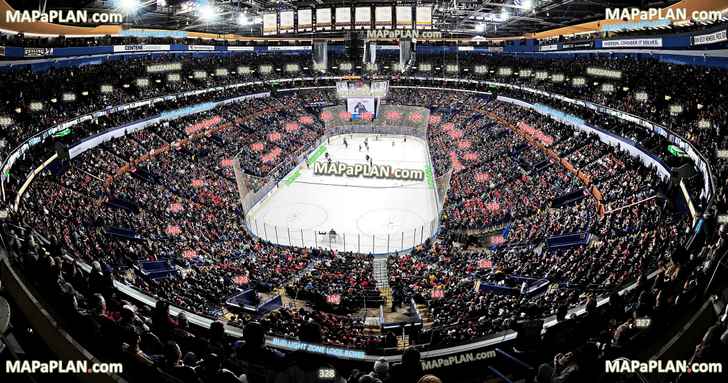
You can view, download or print a full, high resolution (detailed, large) version of this image by clicking on the plan itself
Disney on Ice & Live - Printable virtual information guide with full exact row letters & numbers floor plan (Row A, B, C, D, E, F, G, H, J, K, L, M, N, P, Q, R, S, AA, BB, CC, DD, EE, FF, GG, HH etc.) - St. Louis Enterprise Center seating chart
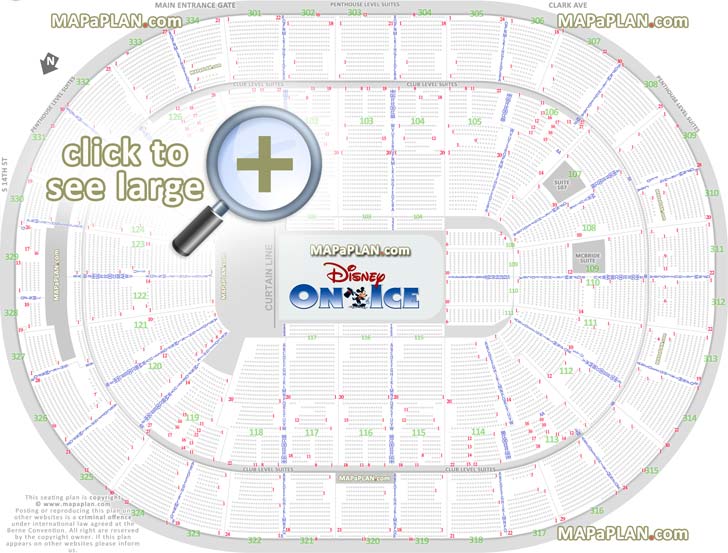
You can view, download or print a full, high resolution (detailed, large) version of this image by clicking on the plan itself
WWE Raw & Smackdown live wrestling & boxing match events - 360 in the round ring configuration showing good, bad, worst seats & executive hospitality rental suites level - St. Louis Enterprise Center seating chart
You can view, download or print a full, high resolution (detailed, large) version of this image by clicking on the plan itself
Performance area for shows, theater & sport events (NCAA wrestling, Ringling Bros, Monster Truck Jam, Nitro Circus, Arenacross, PBR Professional Bull Riders, tennis, soccer) - Virtual image showing how many seats in a row - St. Louis Enterprise Center seating chart
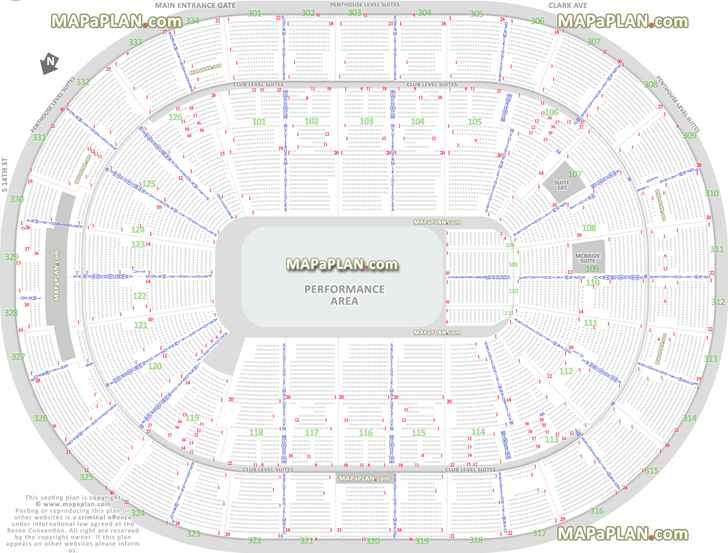
You can view, download or print a full, high resolution (detailed, large) version of this image by clicking on the plan itself
Concert in the round 360 stage setup in Missouri, MO - How many seats per row in sections 101, 102, 103, 104, 105, 106, 107, 108, 109, 110, 111, 112, 113, 114, 115, 116, 117, 118, 119, 120, 121, 122, 123, 124, 125, 126 etc. - St. Louis Enterprise Center seating chart

You can view, download or print a full, high resolution (detailed, large) version of this image by clicking on the plan itself
Marvel Universe Live new show - Interactive balcony best seat selection arrangement review diagram of sections 301, 302, 303, 304, 305, 307, 308, 309, 310, 311, 312, 313, 314, 315, 316, 317, 318, 319, 320, 321, 322, 324, 326, 331, 333, 334 etc. - St. Louis Enterprise Center seating chart
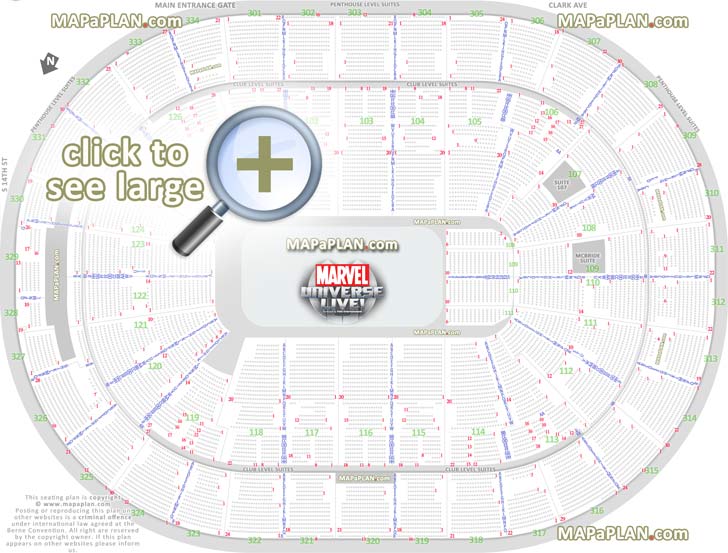
You can view, download or print a full, high resolution (detailed, large) version of this image by clicking on the plan itself
UFC & Bellator MMA fights fully seated setup chart viewer without Standing Room Only (SRO) area - Main entrance gate & exit detailed map - Wheelchair, disabled, handicap & accessible seats - St. Louis Enterprise Center seating chart

You can view, download or print a full, high resolution (detailed, large) version of this image by clicking on the plan itself
What are the section numbers in the St. Louis Enterprise Center, Missouri, MO (formerly Kiel Center or Savvis Center)?
St. Louis Enterprise Center has a capacity of between 10,000 - 22,000 seats (depending on the event) located in the following sections:
- Floor sections for concerts - A, B, C. There may also be Pit or General Admission standing areas. Additionally for some events there may be additional sections (D, E, F, G, H).
- Floor sections for basektball games may include additional courtside & VIP seats.
- Plaza level (100 lower level) sections - 101, 102, 103, 104, 105, 106, 107, 108, 109, 110, 111, 112, 113, 114, 115, 116, 117, 118, 119, 120, 121, 122, 123, 124, 125. The Club Level seats are located in rows BB-HH in sections 126, 101-106, 113-119. The Penalty Box, Glass, Blue Chip Low, Rinkside, Center, Main, End Goal, West, East, Lower, Upper, rear of stage view, sideline, baseline and corner sections can be located on the seating charts above. The St. Louis Blues Home Team bench is at the front of sections 102-103, whereas the Visitors bench is at the front of sections 103-104. The home team side shoots twice (double attack) towards sections 109-110.
- Mezzanine level (300 level, upper tier balcony bowl sections) sections - 301, 302, 303, 304, 305, 306, 307, 308, 309, 310, 311, 312, 313, 314, 315, 316, 317, 318, 319, 320, 321, 322, 323, 324, 325, 326, 327, 328, 329, 330, 331, 332, 333, 334, 335.
- Club Level Suites - 200, 201, 202 Legends Suite, 203, 204, 205, 206, 207, 208, 209, 210, 211, 212, 213, 214, 215, 216, 217, 218, 219, 220, 221, 222, 223, 224, 225, 226, 227, 228, 229, 230, 231, 232, 233, 234, 235, 236, 237, 238, 239, 240, 241, 242, 243, 244, 245, 246, 247, 248, 249, 250, 251, 252, 253, 254, 255, 256, 257, 258, 259, 260, 261, 262, 263, 264, 265, 266, 267.
- Penthouse Level Suites, Party Rooms & Arena Club - 401, 402, 403, 404, 405, 406, 407, 408, 409, 410, 411, 412, 413, 414, 415, 416, 417, 418, 419, 420, 421, 422, 423, 424, 425, 426, 427, 428, 429, 430, 431, 432, 433, 434, 435, 436.
- Other facilities include: Bud Light Zone restaurant, bar, Loge Boxes & Party Deck, Captain's Corner Suite, 107 Suite, McBride & Sons Homes 109 Suite, Super Suites, Blue Note lounge, Main Entrance Gate.
How many rows are there in the St. Louis Enterprise Center, MO?
Flat floor seating sections typically have rows from 1 up to 45 (1, 2, 3, 4, 5, 6, 7, 8, 9, 10, 11, 12, 13, 14, 15, 16, 17, 18, 19, 20, 21, 22, 23, 24, 25, 26, 27, 28, 29, 30, 31, 32, 33, 34, 35, 36, 37, 38, 39, 40, 41, 42, 43, 44, 45).
Plaza level sections have rows from A up to W, followed by double lettered rows AA up to KK (A, B, C, D, E, F, G, H, J, K, L, M, N, P, Q, R, S, T, U, V, W, AA, BB, CC, DD, EE, FF, GG, HH, JJ, KK). Please note that there is no row I or O.
Mezzanine level sections have rows from A up to R.
Additionally some sections have accessible rows (WC, WCC, wheelchair, handicap, disabled, ADA).
The worst seats are located in the back rows on the 300 level. These may offer a relatively limited / partial / obstructed view.
A range of Standing Room Only (SRO) places may be offered for some events.
How many seats are there in a row in the St. Louis Enterprise Center?
The number of seats varies from row to row and section to section, however the typical number of seats is as follows:
Floor sections typically have rows with up to 12 or 16 seats.
Plaza level sections have rows with up to 28 seats.
Mezzanine level sections have rows with up to 30 seats.
How can I find my section, row and seat numbers on the St. Louis Enterprise Center seating chart?
Our Enterprise Center seating charts are designed for easy navigation. Simply pan, zoom in, and zoom out on the high-resolution image to explore the venue in detail. You can quickly locate your exact seat, row, and section by zooming in on the specific area of interest. Each seating plan clearly marks rows, sections, and seat numbers for major sports and concert events.
Can I see a view from my seat for Enterprise Center?
Currently, for some venues, we offer a generic venue view that gives you a visual representation of the seating arrangement. While this image won't show the exact view from your seat, it allows you to see how the sections are laid out within the venue, helping you better understand the overall seating plan structure.
Can I view seating plans for both sports events and concerts?
Absolutely! Our platform features seating maps for a wide range of event types at St. Louis Enterprise Center, from sports games to concerts and other live performances. While venue layouts may sometimes vary depending on the event, we do our best to ensure you have seating chart with seat numbers for your specific occasion.
What are some of the biggest shows that will take place or have taken place in the St. Louis Enterprise Center, US?
Some of the biggest names in show business have been scheduled to perform or performed in the St. Louis Enterprise Center. This includes: 5 Seconds of Summer, 30 Seconds To Mars, Afrojack, Alicia Keys, Andrea Bocelli, Arenacross, Ariana Grande, Avicii, Barbra Streisand, Bellator MMA, Beyonce, Bon Jovi, boxing, Braggin' Rights Universities of Illinois and Missouri basketball game, Britney Spears, Bruce Springsteen, Bruno Mars, Bryan Adams, Celine Dion, Chris Brown, Cirque du Soleil Circus, Coldplay, Davis Cup Tennis, Depeche Mode, Disney, Disney On Ice, Eagles, Ed Sheeran, Elton John, Enrique Iglesias, Eros Ramazzotti, Fleetwood Mac, Foo Fighters, George Michael, Harlem Globetrotters, high school hockey Challenge Cup and Wickenheiser Cup finals, Imagine Dragons, Iron Maiden, Jason Mraz, Jay Z, Jingle Ball, John Legend, Justin Bieber, Justin Timberlake, Kanye West, Katy Perry, Kings of Leon, Kygo, Kylie Minogue, Lady Gaga, Lenny Kravitz, Leonard Cohen, Lil' Wayne, Linkin Park, Lionel Richie, Lorde, Madonna, Mariah Carey, Mark Knopfler, Maroon 5, Marvel Universe Live, Metallica, Michael Bublé, Miley Cyrus, Monster Jam, Muse, NBA basketball, NBA preseason games, NCAA Arch Madness" Missouri Valley Conference College Basketball Tournament, New Kids on the Block NKOTB, NHL hockey, Nickelback, Nicki Minaj, Nitro Circus, One Direction, Paul McCartney, Paul Simon, PBR Professional Bull Riders, Pearl Jam, Pink, Placido Domingo, Prince, Queen + Adam Lambert, Radiohead, Rihanna, Ringling Bros Circus, Robbie Williams, Selena Gomez, Sesame Street Live, Shakira, Shania Twain., Southeastern Conference Men's Basketball Tournament, St. Louis Blues, Sting, Taylor Swift, The Black Keys, The Rolling Stones, The Script, The Who, Timbaland, Toto, U2, UFC MMA Mixed Martial Arts, Usher, Van Morrison, WWE Battleground wrestling."
Related keywords
2023, 2024, 2025, 2025, 2026, 2027, 2028, 2029, January, February, March, April, May, June, July, August, September, October, November, December, Ticketmaster, 3d seat viewer, VIP advice, pdf, photo, pictures, pics, images